Is batting first such an advantage in Tests?
Since the beginning of 2000, teams batting first have won 217 Tests but lost 250, which goes against the bat-first philosophy that has always existed in cricket
S Rajesh
22-Nov-2013
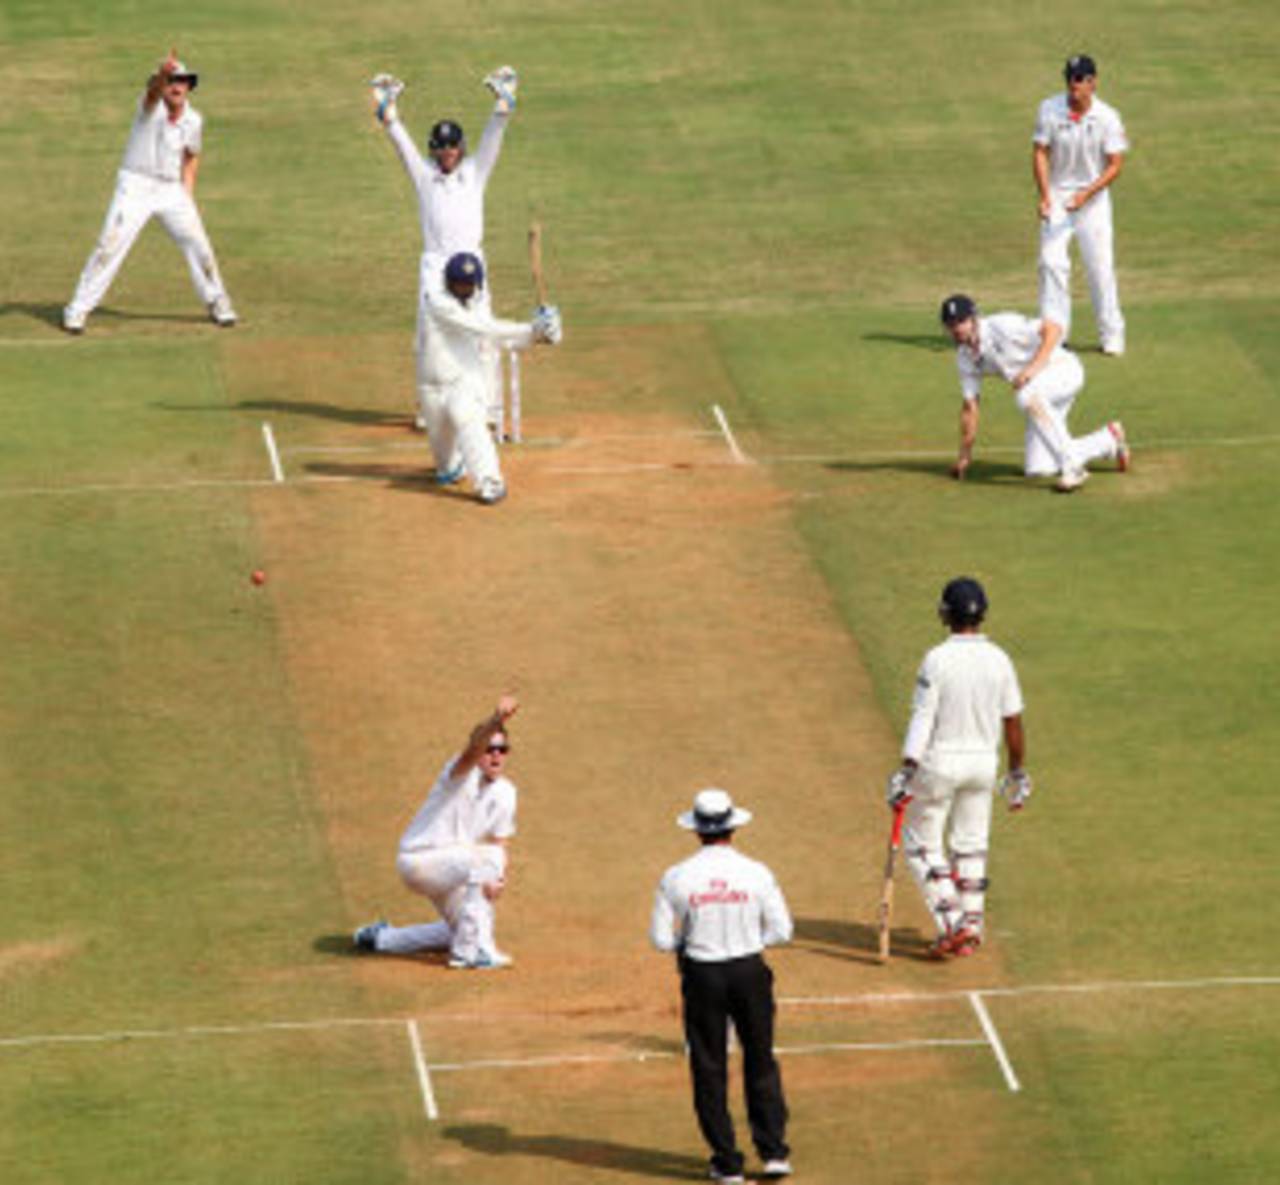
Eight of the last nine Tests in India have been won by the side batting second, including two by England last year • BCCI
"Win the toss and bat first" is a refrain which is almost as old as cricket itself. Experts have always reckoned that making first use of a pitch is almost always the right move in a Test match, for it gives the batsmen the chance to bat when the track is supposedly at its finest, and the bowlers the opportunity to make use of a wearing surface on the last day.
In the early days of Test cricket, that was undoubtedly the best way to win a Test match: in 274 games till the end of the 1930s, teams batting first won 117 Tests and lost 81, a win-loss ratio of 1.44. Till the end of the 1970s, that theory still held good: in 867 Tests, the side batting first won 309 and lost only 236, a ratio of 1.30. (Click here for the decade-wise list.) When captains won the toss and batted, they won 268 times and lost 202. It isn't a surprise that the experts still reckon that when in doubt, think about it and then decide to bat anyway, for that used to be the winningest strategy when most of them played the game.
In the last three decades or so, things have changed quite significantly. It could be a combination of several factors: perhaps pitches have more juice at the start than they used to; perhaps they stay true longer; in the last decade and a bit, Tests have also been regularly finishing inside four days, which means the fifth-day pitch doesn't come into the equation at all. Perhaps it's a combination of these factors, and a few others as well, but the upshot is that teams batting first no longer carry a significant advantage in Tests. In fact, since the beginning of 1980, they've lost more than they've won: 390 wins, against 443 defeats, a win-loss ratio of 0.88 for the team batting first. Thanks to this reversal, the overall lead in victories for the team batting first has been cut down to 20: 699 wins, and 679 losses.
The period when it all changed was the 1980s: from a win-loss ratio of 1.42 for the teams batting first in 1970s, the ratio slipped by almost half to 0.72 in the 1980s. More specifically, the change came in the three-year period between 1984 and 1986, when teams batting first won only 15 Tests but lost 37, a ratio of 0.41. (Click here for the year-wise results between 1970 and 1989.) Australia and England were the teams that struggled the most when batting first during this period: Australia had a 1-10 record, losing four against West Indies and three each against New Zealand and England, while England were slightly better at 2-11. West Indies, expectedly, didn't have a problem in either circumstance, with a 7-0 record in 11 Tests when batting first, and 12-2 in 16 when fielding first.
In the 1990s the results evened out, but since 2000 teams batting second have again had an edge. In fact, captains who've won the toss and fielded first have achieved much better results since 2000 (win-loss 88-69) than those who've batted first (148-162).
The percentages column is interesting too: in the 1980s captains were a lot more willing than earlier to field first - the percentage almost doubled - and the move produced willing results too, with the win-loss numbers being 43-23 when captains put the opposition in to bat. Since the 1990s, the decade percentages have stayed around the same, with teams inserting the opposition in to bat roughly once every three Tests.
| Batting first | Winning toss and batting first | ||||||
| Period | Tests | Win-loss | Ratio | Tests | Win-loss | Ratio | Percentage* |
| 1960s | 186 | 54-43 | 1.25 | 156 | 47-32 | 1.46 | 83.87 |
| 1970s | 198 | 67-47 | 1.42 | 153 | 52-36 | 1.44 | 77.27 |
| 1980s | 266 | 60-83 | 0.72 | 157 | 37-40 | 0.92 | 59.02 |
| 1990s | 347 | 113-110 | 1.02 | 228 | 75-77 | 0.97 | 65.71 |
| 2000s | 464 | 159-191 | 0.83 | 306 | 107-121 | 0.88 | 65.95 |
| 2010s | 158 | 58-59 | 0.98 | 104 | 41-41 | 1.00 | 65.82 |
| Fielding first | Winning toss and fielding first | ||||||
| Period | Tests | Win-loss | Ratio | Tests | Win-loss | Ratio | Percentage* |
| 1960s | 186 | 43-54 | 0.79 | 30 | 11-7 | 1.57 | 16.13 |
| 1970s | 198 | 47-67 | 0.70 | 45 | 11-15 | 0.73 | 22.73 |
| 1980s | 266 | 83-60 | 1.38 | 109 | 43-23 | 1.86 | 40.98 |
| 1990s | 347 | 110-113 | 0.97 | 119 | 33-38 | 0.86 | 34.29 |
| 2000s | 464 | 191-159 | 1.20 | 158 | 70-52 | 1.34 | 34.05 |
| 2010s | 158 | 59-58 | 1.01 | 54 | 18-17 | 1.05 | 34.18 |
During the recording of Match Point, ESPNcricinfo's live show over the India-West Indies Test series, Sanjay Manjrekar, one of the experts on the show, made an interesting observation: he pointed out that the advantages of winning the toss and batting first was over-rated, especially in India. Explaining further, he said that the early moisture on Indian pitches help bowlers - both fast and spin - take a few early wickets before flattening out into a batting surface. The teams batting first thus tend to recover from the early setbacks to post reasonable, but not daunting, totals. The teams batting second play when the pitch is at its best, post huge totals, and the lead is usually enough to take the fourth-innings dangers out of the equation.
The last few Tests in India have followed exactly that template: West Indies lost both Tests batting first (though it's arguable if they would have fared any better batting second, or batting three times in each match), as did Australia four times earlier this year. Even India lost twice to England last year when they batted first. Of the last nine Tests in India, the team batting first has lost eight. (Click here for the list of Test results in India since 2000.)
The table below shows the win-loss record for teams batting first in each country since 2000, and India is right at the bottom of the list: teams batting first have won only 16 Tests and lost 31 during this period. India have done better - they have a 11-6 record - but most of the other teams have struggled. (That's also partially a reflection of how dominant India have generally been at home during this period - their win-loss ratio of 3.27 has been bettered only by Australia at home.)
Surprisingly, the country where teams batting first have won the most is England, where the record is 41-34 in favour of the team batting first. In no other country has the team batting first won more matches than they've lost.
| Batting first | Winning toss and batting first | ||||||
| Host country | Tests | Win-loss | Ratio | Tests | Win-loss | Ratio | Percentage |
| England | 98 | 41-34 | 1.20 | 62 | 28-19 | 1.47 | 63.27 |
| Australia | 78 | 33-33 | 1.00 | 57 | 23-25 | 0.92 | 73.08 |
| UAE | 14 | 5-5 | 1.00 | 11 | 4-5 | 0.80 | 78.57 |
| West Indies | 66 | 21-21 | 1.00 | 43 | 14-13 | 1.07 | 65.15 |
| Sri Lanka | 72 | 25-27 | 0.92 | 48 | 19-17 | 1.11 | 66.67 |
| Zimbabwe | 29 | 12-13 | 0.92 | 15 | 6-7 | 0.85 | 51.72 |
| New Zealand | 54 | 16-19 | 0.84 | 20 | 7-5 | 1.40 | 37.04 |
| South Africa | 69 | 25-34 | 0.73 | 39 | 17-20 | 0.85 | 56.52 |
| Bangladesh | 41 | 14-20 | 0.70 | 29 | 9-15 | 0.60 | 70.73 |
| Pakistan | 32 | 9-13 | 0.69 | 23 | 6-8 | 0.75 | 71.87 |
| India | 69 | 16-31 | 0.51 | 64 | 15-28 | 0.53 | 92.75 |
S Rajesh is stats editor of ESPNcricinfo. Follow him on Twitter