How good were India in Australia? Let's look at the control numbers
How often did India and Australia produce uncertain responses from the opposition batsmen, and how often did that uncertainty result in a wicket?
Sidharth Monga
29-Jan-2021
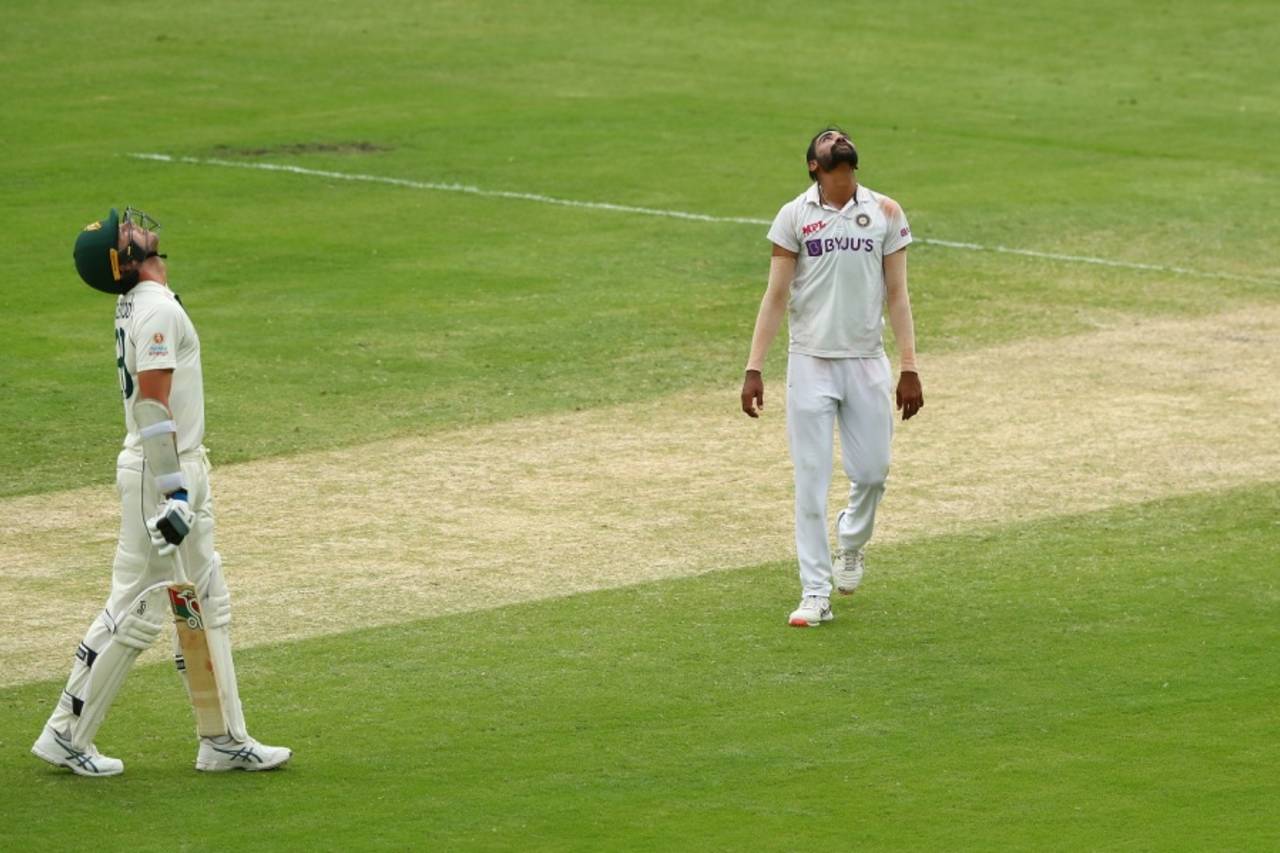
Through the series, it took 11.3 not-in-control balls for India to lose a wicket; for Australia, that figure was 8.5 • Cricket Australia via Getty Images
This was a freak series
Two events of the sort that ought to occur not more than once in six series of four Tests apiece took place in this Australia-India series: India were bowled out for 36 in Adelaide, and then batted out 131 overs for the loss of just five wickets in the fourth innings in Sydney to draw the Test. On the surface these are rare events but look deeper and they are even rarer.
Two events of the sort that ought to occur not more than once in six series of four Tests apiece took place in this Australia-India series: India were bowled out for 36 in Adelaide, and then batted out 131 overs for the loss of just five wickets in the fourth innings in Sydney to draw the Test. On the surface these are rare events but look deeper and they are even rarer.
ESPNcricinfo's control factor metric judges uncertainty in batsmen's response to bowling. Over time, in aggregate, it is an elegant measure of the potency of a bowling attack and of the luck the teams enjoyed. In the Adelaide 36 all out, their bowlers were potent, but the luck Australia enjoyed to go with it was lethal. In a series where a wicket fell for about every nine balls in which a batsman was not in control, India lost a wicket once every 3.56 such balls in that Adelaide innings. We have control data for 1214 Test innings over the last ten years in which eight or more wickets have fallen. Only four times has uncertainty produced more frequent wickets.
The conditions and the Australian bowling made it far worse for India by evoking false responses every four balls. There have been 135 completed innings that have been more difficult than this, but most have featured better luck for the batting side.
Related

Australia's perfect storm catches India in the wrong place at the wrong time
How close was the England-India series?
Bruised and abused, Indians make their own luck at the SCG
Stats - Pujara's marathons, India's debutant deluge, and Lyon, Starc in elite company
Tim Paine: Australia lost key moments throughout series
The pitch in the Wanderers Test of 2017-18 was treacherous, producing a false response every 3.2 and 3.3 balls in India's first and second innings. However, in those innings, they lost a wicket every 14.3 and 14.5 such balls, thus posting a combined winning total.
During the Sydney escape, on the other hand, there was just enough in the pitch, and the Australia bowlers created enough chances, but India enjoyed more luck. Not in terms of catches (because those owe to the opposition's mistakes, and often tend to even out) but because indecisive responses did not result in enough dismissals. Australia produced indecisive responses off 135 balls for just five wickets; on the final day, 93 false responses brought just three wickets. In 193 innings played on the final day of a Test in the last ten years, only four have needed more false responses to create a wicket.
Unlucky India, lucky India
India were desperately unlucky with injuries both between matches and during them. They were also part of an unlucky once-in-a-generation collapse, but overall, once the ball was in play, India were the luckier side in the series - just like they were the less lucky one in England in 2018.
India were desperately unlucky with injuries both between matches and during them. They were also part of an unlucky once-in-a-generation collapse, but overall, once the ball was in play, India were the luckier side in the series - just like they were the less lucky one in England in 2018.
In Adelaide, India lost a wicket every 6.3 false responses to Australia's 7.8, but in the remaining Tests the indecision created by India proved to be consistently more dangerous. Overall Australia created uncertainty every 6.27 balls and India every seven balls, which is a huge credit to an inexperienced attack.
During the 4-1 loss to England in 2018, India created indecision once every 4.3 balls - more often than England, who did so once every 4.8 balls, but lost wickets to indecision more often than the hosts: every 10.7 balls of not being in control to every 14 balls for England. That should put numbers to the feeling that pundits and the Indian team had, that the games were much closer than the eventual series scoreline indicated.
Australia's (lack of) depth
On the 2018 tour of England and the one to New Zealand in 2020, India showed they had the resources to get into competitive positions, but were thwarted by the depth of the home sides - which is usually accentuated in such circumstances because the secondary skills of allrounders blossom in familiar conditions. First Sam Curran and then Kyle Jamieson thwarted India with the bat, much like R Ashwin and Ravindra Jadeja tend to do at home for India at times when the opposition feels they are just one push away from ascendance.
On the 2018 tour of England and the one to New Zealand in 2020, India showed they had the resources to get into competitive positions, but were thwarted by the depth of the home sides - which is usually accentuated in such circumstances because the secondary skills of allrounders blossom in familiar conditions. First Sam Curran and then Kyle Jamieson thwarted India with the bat, much like R Ashwin and Ravindra Jadeja tend to do at home for India at times when the opposition feels they are just one push away from ascendance.
On those tours of England and New Zealand, the home team's bowling allrounders added immensely to their batting depth, but during this series, Australia's batting allrounder, Cameron Green, couldn't do much with the bat - except for score quick runs when setting up a declaration - let alone add depth to their bowling.
Curran scored 272 runs at 38.85 and took 11 wickets at 23.54 in that England series, Jamieson averaged 46.50 with the bat and 16.33 with the ball, and Green averaged 33.71 with the bat thanks to two no-pressure declaration knocks, while taking zero wickets. That it comes down to contributions from the allrounder shows how well India have competed on recent away tours.
Is left right against Cummins?
India had two left-hand batsmen - both in the lower middle order but not restricted to those positions - and Cummins didn't manage to get either of them out in the nine innings they batted between them. Close to 30 overs of bowling for 91 runs and zero wickets to Cummins is a win for the strategy, but it doesn't mean Cummins is an easy bowler to face for left-hand batsmen. Coming into the series he averaged 19.6 against right-hand batsmen and 25.1 against left.
India had two left-hand batsmen - both in the lower middle order but not restricted to those positions - and Cummins didn't manage to get either of them out in the nine innings they batted between them. Close to 30 overs of bowling for 91 runs and zero wickets to Cummins is a win for the strategy, but it doesn't mean Cummins is an easy bowler to face for left-hand batsmen. Coming into the series he averaged 19.6 against right-hand batsmen and 25.1 against left.
Even in terms of creating indecision, Cummins was the second best among the Australia bowlers in the series, but while the 30 false responses induced by him brought him three wickets, none of those was of a left-hand batsman. It was a sound tactic for India to introduce left-hand batsmen into the line-up, and then manage a right-left combination, but it took some luck for Rishabh Pant and Ravindra Jadeja.
Historically right-arm quicks have had to work harder for the wickets of left-hand batsmen, though not to this extent: a right-hand batsman's wicket falls every ten balls of indecision versus 12 balls for a left-hand batsman.
What do the control numbers say about England in India?
It's not always that the luckier side wins; rather, luck becomes more crucial when two evenly matched sides face off. The last time England toured India, for example, they were luckier, losing a wicket every 12.5 balls of indecision as against India's 11.9. However, India's bowlers were superior: they created a false response every 5.6 balls as against England's 7.6. That's 25 more false responses, or two wickets, in a day's bowling. When India toured Australia, this difference was down to nine balls in favour of the hosts. India created 13 more opportunities in a day's bowling than England in 2018. These are close enough margins for luck to play a part. Can England come as close to the hosts as India have been doing on their recent difficult tours?
It's not always that the luckier side wins; rather, luck becomes more crucial when two evenly matched sides face off. The last time England toured India, for example, they were luckier, losing a wicket every 12.5 balls of indecision as against India's 11.9. However, India's bowlers were superior: they created a false response every 5.6 balls as against England's 7.6. That's 25 more false responses, or two wickets, in a day's bowling. When India toured Australia, this difference was down to nine balls in favour of the hosts. India created 13 more opportunities in a day's bowling than England in 2018. These are close enough margins for luck to play a part. Can England come as close to the hosts as India have been doing on their recent difficult tours?
Sidharth Monga is an assistant editor at ESPNcricinfo