Do teams benefit when their batters play long innings in T20s?
Why being set does not translate into enhanced hitting efficiency beyond a point
Himanish Ganjoo
20-Jul-2022
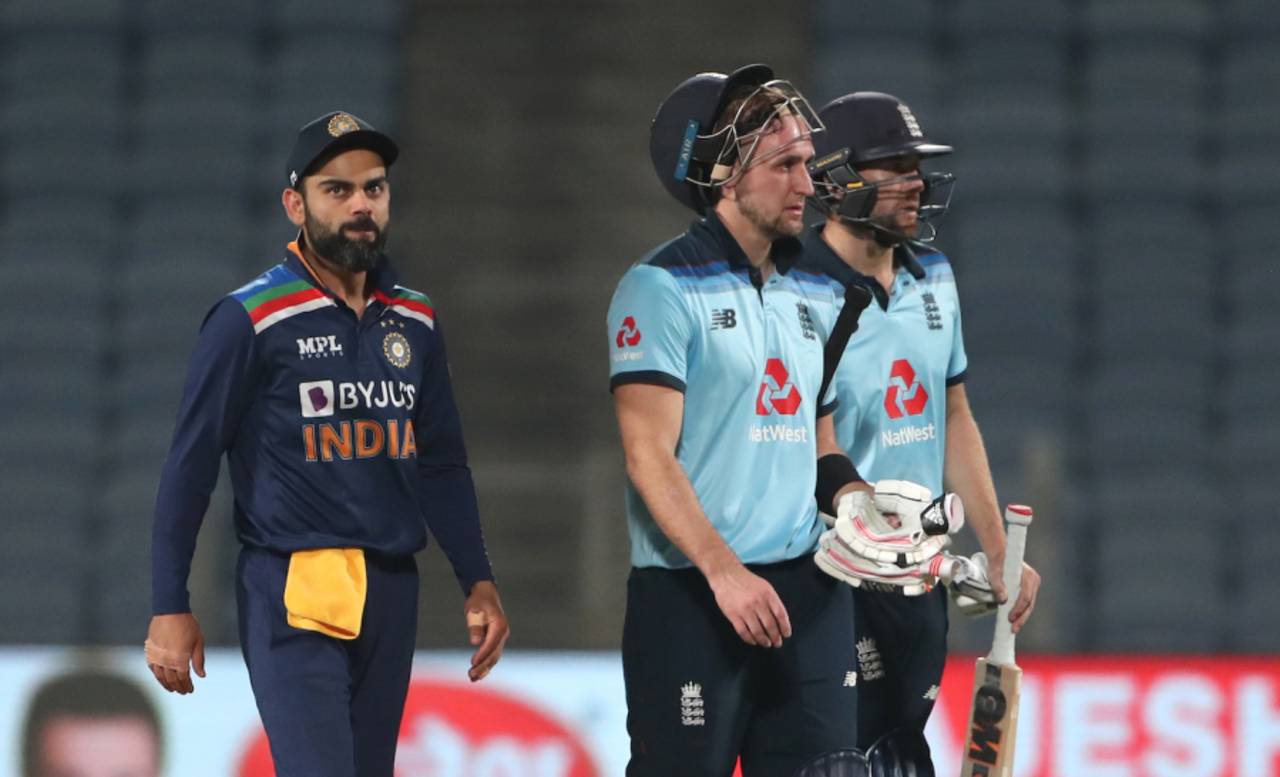
Virat Kohli starts his T20 innings with a scoring rate a shade above the expected rate for the situation but then drops below average. Liam Livingstone, by contrast, consistently scores above the expected rate through his innings • Surjeet Yadav/Getty Images
"Other day in the nets, I don't know who was bowling to him - he faces the first two balls, and he says, 'That's ten off two.'"
This was Kagiso Rabada describing his Punjab Kings team-mate Liam Livingstone in an interview after a match in this year's IPL. In the same chat, Livingstone himself outlined his T20 philosophy: "There is no time for blocks in T20 cricket." He walked the talk in his breakout IPL season with a strike rate of 176.3 in his first ten balls at the crease. This IPL, among the 66 batters who faced more than 60 balls in the first ten balls of their innings, only Jitesh Sharma and Tim David scored faster.
Despite the apparent chasm between T20 and the two longer forms of international cricket in terms of risk-taking, data reveals that batters approach the beginning of their innings with circumspection and take time to "settle down", even in the shortest format. In Test cricket, the risk of a batter getting out increases sharply to a peak at about five runs, after which it slowly dwindles until the batter reaches about 25 runs - the classic "start". This pattern of hazard early in the innings is surprisingly common to T20 batting as well. More remarkably, the peaking of the hazard happens regardless of which phase of the innings you start in.
The plot below shows the "hazard function" - the relative rate of getting out after making some runs - for each phase of a T20 innings. The data is taken from more than 2500 high-level T20 matches since 2015, including T20Is, IPL, PSL, CPL, Big Bash and T20 Blast games. The curve for each phase - in a different colour - considers only the innings which start in that phase. For instance, the red curve only accounts for batters who have walked in to bat in the death overs.
There is remarkable similarity in the rise of the hazard function till about five runs, the initial phase when batters are vulnerable. After that, the hazard falls as a player gets "settled". The peaks of the curves are different in different phases, which marks the difference in the amount of risk-taking as an innings progresses, but the shapes of the different curves agree. "Getting your eye in" is a real effect, even in T20s and even in the slog overs.
While this settling-in pattern is a consequence of how batting works, classical thinking about batting sometimes ascribes value to being set when it comes to hitting. There is a belief that being more set, i.e. spending more time at the crease enables the batter to hit better. This idea guides certain top-order batters - KL Rahul being perhaps the foremost example - in batting through the innings so they can hit at the death. The data, in fact, reveals that when it comes to hitting, there is limited utility in spending more time in the middle.
The chart below shows the mean strike rate of batters in the slog overs (17-20) as a function of how many balls they have played before the death overs. The more balls they have faced, the more "set" they are. After about 20 balls at the crease, the returns hover between a strike rate of 140 and 160. The strike rate fluctuates without any trend if one enters the slog overs having faced more than 20 balls. There is no extra benefit from being "more set" after a point.
The chances of losing a wicket also fluctuate wildly, not decreasing if the batter is more set (as the plot below shows). The slog overs demand high risk; being "set" does not offer better efficacy at executing high-risk shots beyond the 20-ball mark.
The data suggests that batters get "set" after about 15-20 balls in the middle. Their strike rate stabilises, reaching its cruising value. It turns out that this behaviour, which can be described as ramping up steadily to a final, stable strike rate, is universal across game situations. The next two charts illustrate the point. They show the average runs scored off a given ball in the batter's innings. A regression model - a mathematical predictor - was trained to predict this for each phase of the innings for different values of wickets lost in the innings. Information from 589,000 balls from the same set of high-level T20 games since 2015 as described above was used to inform this model.
In the first plot below, the four lines correspond to the four phases of the innings. All the curves ramp up and reach a flat value of runs-per-ball after the batter has spent about ten balls in the middle.
A similar pattern is seen in the curves when we control by innings phase and vary the number of wickets lost. From an analysis of various such plots, the ten-ball mark seems like the near-universal time for getting "set". A new batter ramps up to a "stable" strike rate in about ten balls.
These plots also illuminate the impact of wickets lost. The stable scoring rate for a settled batter is much higher than the strike rate they start at, and the figures below quantify how many runs a team loses when they have a new batter at the crease.
A set batter would bat at his stable strike rate - the flat portion of the curves above in each situation. A new batter starts afresh at a slower rate, taking ten balls to achieve the stable strike rate. The difference in the runs scored by the set batter at the stable SR and the runs scored by the new batter as they "ramp up" is the number of runs lost due to the settling-in process.
This table puts numbers to the adage that wickets slow the scoring rate down. In the slog overs, the loss of a wicket leads to a loss of four to five runs per ten balls. This is because the stable strike rate at the death is very high, which means that settling in is costlier than other phases. At the other end, for the first two wickets in the powerplay there is a comparable loss of runs because batters are slower to settle down in the early stages of the innings.
The "ramping up" plots can also give us the "ramping strike rate" - the expected scoring rate in the first ten balls, depending on the innings phase and situation. This number lays the baseline for how quickly a new batter scores while getting their eye in. The regression model mentioned above is used to predict these values, listed in the table below. As expected, the ramping strike rate increases as we move from the start to the end of the team innings as batters take more risk. It decreases as more wickets are lost as new batters play more carefully.
The ramping strike rate can be used to ascertain exactly how a batter's innings starts relative to the expected scoring rate, factoring in leeway for settling in. Instead of quoting a batter's first-ten-ball strike rate, which does not account for innings situation, we can calculate a "strike rate above-ramping" (SAR). To calculate the SAR, consider every ball a batter has faced in his first ten balls and take the average of the following:
SAR on the Ball = Runs scored off the ball - Expected runs in that situation
Here, "expected runs" are the average runs scored by a batter given the number of balls faced in their innings, the phase, and the number of wickets lost. Considering batters who have faced 600 or more balls in the first-ten-ball phase, here are those with the best and worst SAR per ball - that is, the best and worst innings starters, with the context of their batting situations added in:
Finally, this predicted strike rate, including the "ramping up" feature of the first ten balls, can be utilised in charting the progression of an individual innings compared to the expected strike rate. Including the ramping feature gives a more accurate baseline for when a batter is settling in.
Taking Virat Kohli as an example, we can chart the difference between his actual score at different stages in his innings and the expected runs. The expected runs here account for the innings phase, wickets lost, and the ramping strike rate. The graph shows that Kohli begins his knocks at a slightly above-average rate: he is at 0.06 runs more than average at ten balls, given the situations he bats in. Subsequently, he slows down to settle in - he is 2.4 runs less than expectation at the 30-ball mark. By the time he has faced 50 balls, he is closer to the average runs scored at 50 balls (0.7 runs behind). In other words, if he gets out between ten and 50 balls, he has lost his team runs compared to the average batter in the same situations.
While Kohli's innings progression is relatively close to the average line, Andre Russell and Liam Livingstone stay well above par throughout their innings. Russell is already 3.3 runs over average by the time he faces ten balls, a difference that grows the deeper he bats - which means his scoring rate keeps getting better throughout his knocks. Livingstone is similar, although less extreme.
At the other end of the spectrum, Kane Williamson, Ajinkya Rahane and Babar Azam not only start slowly, they keep losing their team more runs the deeper they bat. Remember that the arrival of a new batter also loses a team runs, so one can argue that these batters are preventing that loss by staying set. However, as we have seen above, being "more set" does not necessarily translate to better hitting results, and the dismissal rate while trying to hit is also unaffected by how set a batter is. Considering this, classical batters who occupy the crease are sunk cost for teams. By the time they bat 40 balls, they are already five to six runs behind, and their time at the crease confers no advantage in terms of survival or hitting, which means new batters are likely to come in and lose more runs regardless.
Yet we see top-order batters preserve their wickets in T20s, often beyond the optimal duration in the middle. The logic of remaining at the crease is twofold: firstly, batters believe that being set means they can hit better. We have already seen that this might not be true - spending time at the crease past ten to 15 balls does not necessarily translate to better hitting ability or greater chances of survival later in the innings. The second reason behind wicket preservation is that it stems the drop in the scoring rate in the event of a new batter coming in; this part is indeed true.
How fast does a batter have to score in a given situation to justify staying at the crease just to prevent this fall in scoring rate while his replacement settles in? The predicted first-ten-ball strike-rates in each situation tell us how fast a new batter would score if a wicket were lost at that point. The batter who is choosing to stay in must go faster than this to justify staying in. The ramping strike rate table earlier in the piece shows the first-ten-ball strike rates for a new batter at the fall of each wicket in different phases of the game. For instance, the batter coming in at one-down in the 12-16 over phase has a strike rate of 128.6 in his first ten balls - the batter preserving his wicket must score faster. These are averaged numbers, but they establish rough guidelines for the balance between wicket preservation and scoring rate.