Player Ball Difference: An interesting new concept
A look at the fastest and the slowest innings in cricket using a new concept - Ball Difference. And, yet another Bradman surprise
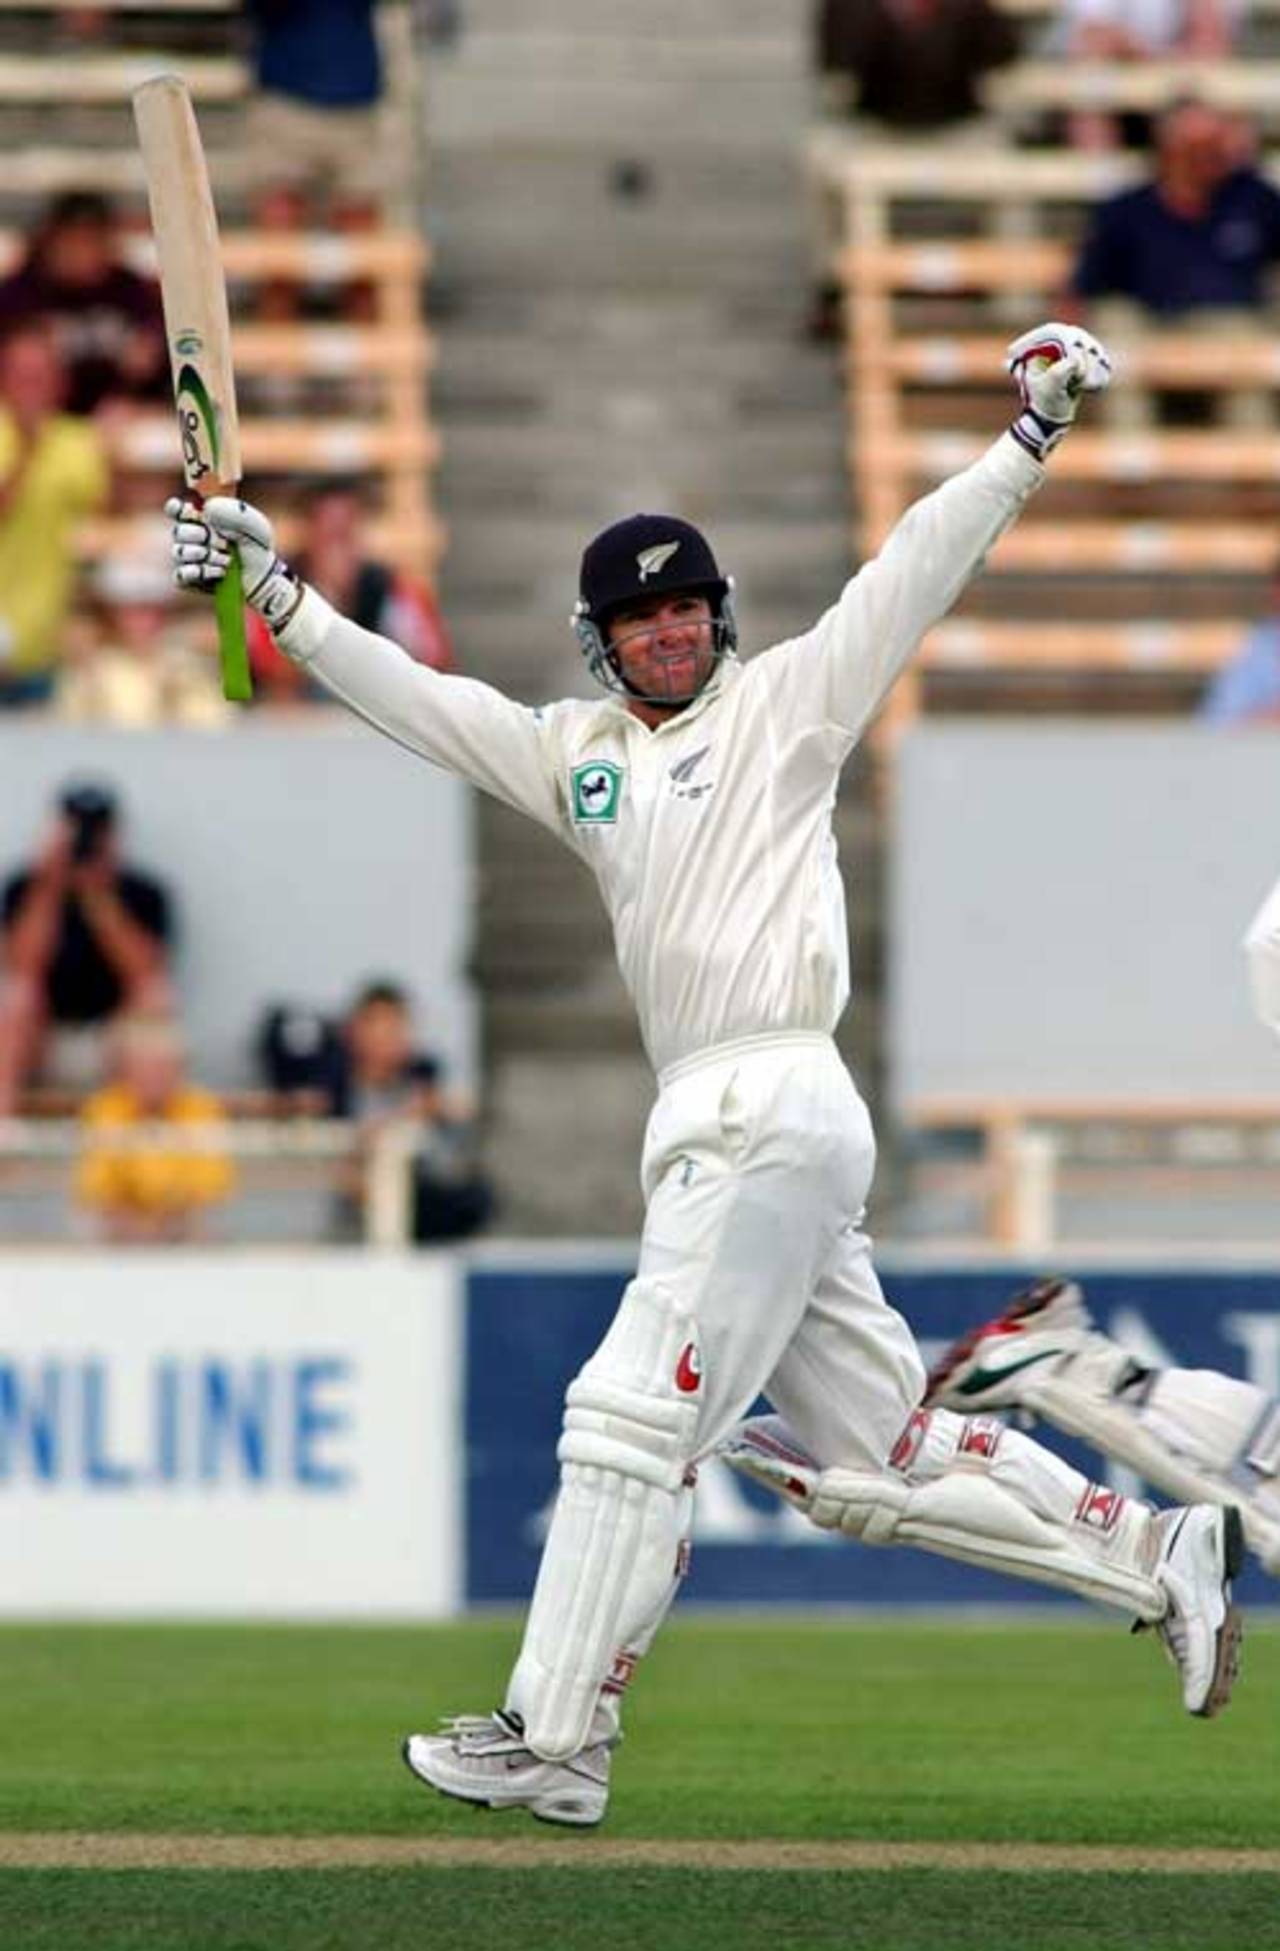
Nathan Astle's 222 in just 168 deliveries against England at Christchurch ranks as the fastest innings in Tests in terms of ball difference. • Ross Land/Getty Images
Ball Difference is a favourite measure of my dear friend, Milind. Especially in the limited-overs edition, he feels that the Ball Difference is a far superior measure to evaluate performance of different teams and players. He has suggested Ball Difference as a far sounder resolving method than the intrinsically weak net run rate to determine group placing. The concerned blog(s) can be read by clicking here.
The Ball Difference value has a greater relevance as far as teams are concerned. The term Ball Difference has two connotations. Applied to a team it is the difference in balls required by teams to achieve the same target. If the chasing team takes 44.2 overs to overhaul a first-innings total of 250 made in 50 overs, the Ball Difference is 34. Milind's post explains this clearly. However it has its own charm when applied to individual performances. For these, the Player Ball Difference (PBD) is the difference between "runs scored" and "balls faced". In this article I will look at the PBD values, both positive and negative, in both ODI matches and, of greater interest, Test matches.
First let us see what PBD has to offer which the more straightforward Strike Rate (SR) does not offer, especially in ODI matches. Let us take three ODI innings with differing SR values. A 100 runs in 75 balls, 50 in 30, and 20 in 10. The SR values are 133, 166 and 200. However in terms of value to the team, the first one is probably the most valuable, the 50 follows closely and then the 20. I am sure there would be situations when the 20 in 10 could very well be a match-winning cameo, but we are talking about normal context-independent situations.
This can be explained in this manner. The true value of the SR figure is not known until we know more about the innings itself: How many runs were scored, leaving the context outside? In all my quick scoring tables or analytical steps, I have always needed to qualify the SR with another number.
However the PBD work is almost wholly independent of other factors. Let us take a PBD of 25. This could be 100 in 75, an invaluable innings. It could be 60 in 35, possibly as important an innings as the first. Finally it could be 40 in 15, a ripper of a cameo, possibly a match-winner. Thus it can be seen that the 25 balls gained by the batsmen in different scenarios, play important roles in achieving the team objectives. The reasonably high number 25 prevents blink-and-miss flashes like 20 in 10.
Let us now take a PBD of 50. This could be 150 in 100, 100 in 50 or 75 in 25. All are potentially match-winning innings. The 50 does not allow even good cameos like 60 in 30 to be considered.
Now let us look at the ODI innings with high PBD values. This is a graph-only article. The tables are available for viewing/downloading. The graphs have been developed in such a way that the more the innings line is to the left, the higher the PBD and the higher the innings line is placed, the higher the score.
ODI: High Ball Difference values
When Rohit Sharma played his record-breaking innings a few days back I must be the only person aware that amongst many other records, the PBD record was up for grabs. At the end of the 48th over Rohit's PBD was only 81 and he did not look like overtaking Shane Watson's amazing 89. Then the 4, 6 and 1 took him to 89 at the end of the 49th over. In the last over he went past Watson with a four. At 100, he had a PBD of zero!
Shane Watson's bull-dozing innings against Bangladesh gave him a PBD of 89. It is frightening to note that Australia played only 26 overs. If they had batted first and Watson played similarly, we might very well have seen the first 300 (what? surely you must be joking!) in ODI internationals.
Then comes Corey Anderson's blitzkrieg against West Indies, with a PBD of 87. Virender Sehwag's 219 makes it to the top ten. Herschelle Gibbs' innings of 175 (PBD of 70) spearheaded the incredible chase of 434. Incidentally Ricky Ponting's 164 in 105 (PBD 59) in that famous match, is the only losing innings in the top 25.
Shahid Afridi, with his two lightning-fast hundreds is the only player to have two innings in the top ten. He also has another innings in the 12th place. Brendon McCullum's unbelievable 80 off 28 (PBD of 52) is the only sub-100 innings in the top-25.
ODI: Negative Ball Difference values
The benefit of the PBD measure is confirmed by the way these tables have been created. Just a straight-forward reverse ordering on the BD: No other criteria.
The first entry is the well-known Sunil Gavaskar effort. The PBD was an unbelievable -138. Let us be fair to the great man and give him the benefit of doubt. It is possible that Gavaskar (and his team-mates) just did not read the intricacies of the new game (after all this was the third ODI for India) in proper. As Gavaskar showed later at Delhi and Hyderabad, he was second to none in stroke play.
Unlike the high PBD value innings where the top-25 had a 96% won record, the slow scoring does not always lead to a defeat. Three of the top ten and seven of the top 25 such innings ended on the winning side. Since England was chasing only 160, even Mike Brearley's crawl of 44 in 147 led to a win.
It can also be seen that only five of the top-25 innings were played by the Associate countries. The other batsmen were from the established countries. But it is quite revealing that no such innings has been played during the past ten years. Gavaskar, Ravi Shastri and Mudassar Nazar are the three batsmen who have two such innings each in the top 25.
Now for the Test PBD analysis. It should be understood that the PBD dynamics in Tests are quite different. In the history of Test cricket, there are only two PBD values exceeding 50 and only 41 values exceeding 20. So this is a rare commodity. Also the negative PBD values could hit the stratosphere. So the table formations for the slow scores require some thinking. First let us look at the fast scorers.
Test: High Ball Difference values
It is not a surprise that the table is headed by Nathan Astle's once-in-a-lifetime innings of 222. This was an innings that defied and even today defies, description. Only the uninformed would say "Astle had nothing to lose". He single-handedly converted the most desperate of situations to one which sent shivers down the collective spines of the English supporters. Who knows? Another 15 minutes of the mayhem and he might have won the match for New Zealand. A score of 222 in 168 meant a PBD of 54. I hope this number stays forever as the record.
Then come three similar innings. All were played in the third innings, all were efforts to speed up scoring looking for a declaration and all produced 50-plus ball hundreds. Viv Richards played two balls more and hit boundaries after the 100 and finished with a PBD of 52. Misbah-ul-Haq declared immediately afterwards and had a PBD of 44. Same thing happened with Adam Gilchrist who had a PBD of 43. All totally different to Astle's innings or the Sehwag innings which follows next.
Sehwag against Sri Lanka, made the good Sri Lankan total of 400 as virtually nothing. His 293 took him only 254 balls and his PBD was a magnificent 39, in a near-300 innings. Another few balls would have seen a third 300 and a possible PBD record.
Then comes Ian Smith's famous classic of 173 in 136 (PBD of 37) made batting at No. 9. Shades of the Astle innings there. Smith came in at 131 for 7 and took his team to 391 all out. Tim Southee's 77 off 40 was played in his debut Test. Incidentally Southee has hit 50 sixes in 36 Tests.
Out of the top-ten innings, five were match-winning efforts, four were in losing causes and Smith's innings was in a drawn Test. There are more losses than wins in the top 25, indicating that scoring quickly is not necessarily the way to come out trumps in Tests.
Test: Negative Ball Difference values - No criteria applied
Now we come to the high negative PBD values in Tests. I have done this in two ways. The first table is one in which the sole order is the PBD itself. So this necessarily brings out the long innings. In the second table I have set an upper limit of 20 runs, just to have a look at the really slow scores. Incidentally all the Test analyses have only been done where correct "Balls played" information is available. So the Hanif Mohammad-type of innings were excluded.
This is an easy table to describe. Len Hutton's 364 in 847 leads the table with a PBD of -483. Then comes Sid Barnes' 234, with a PBD of -433. Wally Hammond's slow hundred against Australia follows next with -426. The only modern innings in the top five is Shivnarine Chanderpaul's 136 with PBD value of -374.
Probably the most interesting innings in the top ten is Trevor Baileys's 68 in 427 balls, leading to a huge PBD of -359. This is the only sub-100 innings in this lot.
A few important defensive innings; Mike Atherton's epic 185 has a PBD of -307. Gautam Gambhir's match-saving 137 has a PBD of -299. Gavaskar's 172 clocks in at exactly -300. Faf du Plessis' defensive classic has a PBD value of -266. McCullum's masterpiece of 302 has a PBD of -257.
Test: Negative Ball Difference values - Below 20 runs
This is the only table for which I applied a cut-off. The cut-off is a score of 20. This is to have a look at the really low scoring innings.
Yashpal Sharma's slow 13 in 157 leads, if you can call it that, the 'slow cyclers'. Most of these innings are from the previous eras. There are a number of bowlers in this list indicating that these are good supporting innings. The most amazing innings in this lot is the 3 made by John Murray for England. He took exactly 100 balls. Let us not also forget Geoff Allott's 0 in 77 balls.
Since positive PBDs are the order of the day in T20s, I have only given the five highest and three lowest values.
T20s: Extreme PBD values
Finch       156 (63)  93
Levi        117 (51)  66
McCullum    123 (58)  65
McCullum    116 (56)  60
Gayle       117 (57)  60
....
....
NJ O'Brien   11 (30) -19
Alok Kapali  14 (35) -21
NM Odhiambo  13 (36) -23
I have compiled the top-25 entries for each of these tables and uploaded the same.
Please click HERE to download/view the ODI document.
Please click HERE to download/view the Test document.
Now for the Bradman piece. This is a continuation of the last time's piece. The scan is the Australian team's tour programme of 1930. To view this, please click HERE.
Note that Australians played 12 first-class matches before the first Test. Now the teams play half the number of matches in the entire tour. Also there were a minimum of two matches between every Test. This allowed the visiting team to try out other players and give time in the middle for out-of-form players. Add to these, the sailing to and from England: That was one long tour. Compare this with the current Australia tour by India. Before facing Mitchell Johnson and company, the Indians played a totally inconsequential two-day game against an Australia-C team with virtually no first-class experience.
As I am about to send this article I heard the tragic news on Phillip Hughes. I am not able to coherently put down my feelings in words since I am crying. What a tragedy? Today, with so much technology available, should there be such instances? Should not there be protection wherever needed? How can life go on, with business as usual? With the suspect techniques of many T20 specialists, how are they going to tackle the demands of Test cricket? Too many questions and virtually no answers.
All our thoughts are with Phillip's family. May God be with them all at this time of great loss!
Anantha Narayanan has written for ESPNcricinfo and CastrolCricket and worked with a number of companies on their cricket performance ratings-related systems