All the quirky Test numbers
What's the lowest score that's never been made? How obsessed are batsmen with 100s? What's the most popular all-out total? A look at these, and many more unusual stats
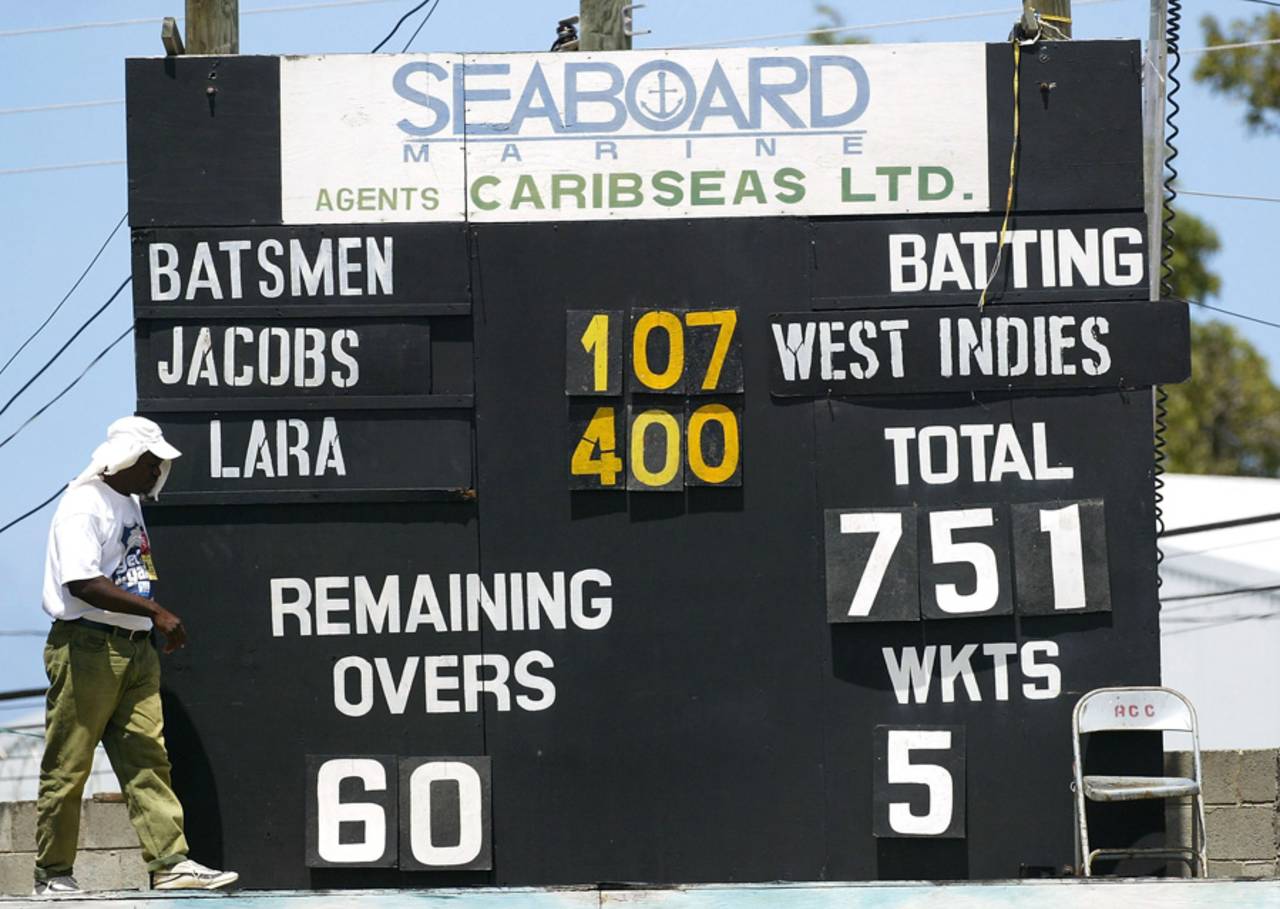
Brian Lara's 400 not out in Antigua is the highest individual Test score • AFP
This is a very different article. For some time now I have wanted to take an irreverent look at some of the numbers relating to Tests. I have done enough of serious number-crunching and analytical articles. This article is going to be fun. At the same time there are enough interesting sparks to make the readers think.
As such, I want to only add in one caveat, in the form of a message. I understand that the self-styled academics and fault-finders will not find this article interesting, not that they found anything of value in other articles. My message to them is, if you do not have fun with this type of analysis, it is your problem. Do not transfer that problem to others by making inane and worthless comments. My thanks, in advance, for this consideration.
I am going to look at Test batting, purely from the numbers point of view. In this article there might be a player or two mentioned, that will be all. I will look at the batsman scores, team scores, team fall of wickets, the related frequencies, the limits of these number of occurrences, the surprises and the patterns, with no reference to the executors of these numbers. I can assure you that you will find enough interesting gems in this potpourri of information. My apologies also for some haphazard presentation. The nature of analysis is such.
Batsman scores
Brian Lara (this is the only reference to an individual player in this article) scored an unbeaten 400. Nearly 10,000 batsmen scored the grand total of 0, some unbeaten. Between 0 and 400, 298 scores have been reached by batsmen. That means there are 103 scores yet to be reached. This was news to me also. This amounts to more than 25% of all scores of 400 and lower.
Let this be the starting point. Let us now look at these score distributions closely. To put things in perspective, let me first say that there have been 73,626 innings played during the 136 years of Test cricket. This analysis covers up to Test #2089, the second Test between England and New Zealand. That makes it an average of 35.2 innings per Test, this number makes sense. The maximum, of course, is 44 per Test and this works out to about 80%.
The lowest score not yet reached is 229. Why? I do not know. Considering that 231 was reached five times and 232, six times, there is no reason for this specific number, other than the fact that there has to be one number. The next two scores not reached are 238 and 245.
What is the highest score reached by multiple batsmen? Well, 334 has been reached by two batsmen (I have resisted the temptation to name the two batsmen), 333 by two batsmen and 329 by two batsmen. The beyond-two occurrences are at 275 (three times) and 274, also three times. These are just stray numbers: there seem to be no specific reasons.
What is the significance of 167? There has been no instance of a 167* score. Nor for that matter a score of 171*, 175* and 180*.
Now, for the most interesting of these numbers. Look at the following frequencies.
	Score Freq NO
	96 93 5
	97 75 5
	98 72 13
	99 86 5
	100 149 56
	101 104 27
	102 106 32
	103 108 34
	104 95 20
An innocuous set of numbers! Not at all. Look at the jump between the score of 99 and 100, well over 60%. This jump is way, way beyond the normal increase or decrease by a small number. What are the reasons? One can only surmise.
- The first reason is that the batsmen take a lot more care as they reach 100. That would explain the significant drop between the score of 96 and 97. Maybe the batsmen take that additional care when they come within a stroke of 100. I can hear someone saying 94 is also a stroke away: agreed, but this is a Test match.
- But why such a high number at 100. The only reason for this must be the number of declarations made when a batsman reaches hundred. Is this borne out by the number of not-outs? Of course, yes. Look at the increase in not-outs from five to 56. And the trend continues beyond also. Well over the 99-value of five, indicating later declarations.
- I am amazed at the importance the score of 100 plays. This obsession seems to have been there over the past 136 years.
Does this trend exist when going from 149 to150 or from 199 to 200?. Let us look at the figures.
	Score Freq NO
	147 21 4
	148 27 8
	149 21 3
	150 29 8
	151 24 6
	152 27 5
	...
	...
	Score Freq NO
	197 6 1
	198 2 1
	199 9 2
	200 15 9
	201 21 8
	202 6 2
	203 15 9
What do we have here? Batsmen moving from 149 to150 show less of this trend than the their movement from 199 to 200. It is clear that the score of 200 is deemed to be far more valuable than the score of 150. Batsmen going from 149 to 150 has a change factor of 21 to 29. Their scores going from 199 to 200 shows clear variation trend: 9 to 15 and then to 21. This again indicates many declarations - revealed by an increase in not outs from 2 to 9.
At what score do we have the highest percentage of not-outs? We should ignore the single scores of 400*, 365* et al. There are two instances of scores on which batsmen remain unbeaten 60% of the times. At 200, there were 15 innings and nine were not outs, making this 60%. And at 203 also, there were 15 innings and nine were unbeaten. The previous discussion seems to clearly pave the way for this. As soon as the batsman reached 200, indicating a team score exceeding 400, there were declarations. Not always, of course. Incidentally there were two unbeaten innings of 199. At 100, the % of not outs is a very high 37.5%.
Now, for some statistical derivations.
The 50-percentile mark appears between 12 and 13. That means over 50% of innings have scores below or at 13. The Median value of scores is 13. The 90-percentile mark is reached between the scores of 68 and 69, meaning that below 10% of the scores are above 69. The Weighted Mean (by the frequency of such scores) of all scores is 28.3. In terms of runs scored at a specific score, the score of 30 gets the top place. There are 680 occurrences, leading to a total of 20,400 runs. I am not sure whether these figures mean anything to readers. But it is a nice thing to round up the analysis.
The graphs for this article were quite difficult to do. There were two problems. The range was mind-boggling: 0 to 400, 0 to 952 and 26 to 829. This made drawing of graph quite difficult in view of ESPNcricinfo's limit of 640 pixels for the graphs. The bigger problem was the value of numbers. Over 10,000 for a score of 0 and 1 for 400 and a similar situation for the team scores.
Hence I have adapted different methods. For the Batsmen scores I have not looked at the entire range of 0 to 400 which would have been impossible to handle from both X and Y axis point of view. So I zeroed into a range of 80 to 220. These are important scores and the exclusion of scores up to 80 meant that the frequencies were more manageable. Anyhow the high scores had very small numbers.
The graph is self-explanatory. Readers can see visual evidence of all what we have discussed so far. The drops before 100, the huge spurts after reaching 100 and the moderate spurts around the 150 and 200 marks. There is no clear pattern emerging other than a general decrease in values.
Team scores (All)
In the 2,089 Tests 7,561 innings were played. The qualification is that at least a ball should have been bowled. With this macro number in place let us see some of the interesting facts about these numbers. First I will look into the set of all innings, complete and incomplete.
The range of team scores is 0 to 952. Yes, you read it correct. Zero was a valid score. I wondered whether my program had gone wrong. But then I may go wrong but my program, never. So I went and checked. Yes, it is true. In Test# 1293, New Zealand scored 0 for 0 off a single ball bowled by Sri Lanka. Why did they play a single ball? Wisden Almanack reports that "Vaas bowled one ball of New Zealand's second innings before the umpires agreed that the light was too bad."
The highest score is 952 and everyone, especially the Indian bowlers, would have painful memory of those 3 days. It is a fair guess how many days might have been needed in this Test to produce a result: Maybe 11. The lowest three scores not reached are 18, 56 and 557.
The score distribution for all innings follows a normal distribution between zero and 600. Beyond that the numbers are very low. The most popular score is 296, with 37 occurrences. Then come 252 and 223, with 34 occurrences each. Why? I have no idea. I am as much bemused as you are, with these specific numbers. And may I ask why there should be 10 scores of 521 and 1 of 525 and 2 of 514? Sure beats me.
I will not be doing any statistical derivations for these types of team innings since there are many short innings, especially in case of wicket-wins, and these distort the numbers.
Since there are 950+ individual scores reached by different teams, it is not possible to do a graph with the individual values. Even a pixel-a-score will go past 640, the maximum graph size. Hence I have grouped these scores in lots of ten score values. 0 to 9, 10 to 19, 20 to 29 and so on. Then we can at least get an idea of the distribution.
The graph follows a reasonably well-defined normal distribution between 0 to 600 and then an extended tapering off. Since these are scores in ranges (120-129, 210-219 and so on), this only gives an idea of the score distribution. The highest frequency is at the score range, 250-259, with 265. The next highest is some distance away, at 220-229, which has a frequency of 259. Surprisingly the next best is further back, 190-199, with a frequency value of 240. Let us not forget that many of these innings might be third innings declarations and fourth innings chases.
Team scores (Completed)
Now for the completed innings, which I will define as those in which all ten wickets were captured. There were 5,317 such completed innings. It is obvious that I do not include both the declared innings as well as those where one or more players did not bat.
The score distribution for all innings follows a normal distribution between 0 and 600. Beyond that the numbers are very low. This range is 26 to 849. Twenty-six was New Zealand's total against England in 1955. A deficit of 46 in the first innings, this eminently forgettable innings and a loss by an innings and 20 runs. It is amazing that this total was in danger of being toppled recently from its pedestal by Australia.
"849 all out". That surely reads funny. What was England aiming at? I know these were the days of timeless Tests. But 849 was surely a lot of runs. On top of that they did not enforce the follow-on, when ahead by 563 runs and as justice would have it, West Indies batted for nearly two days and drew the match. The next highest score is 747, made during 2005 by West Indies against South Africa.
There are quite a few scores not reached by dismissed teams below 60. Hence, looking at 60-plus scores, we find that no team has ever been dismissed for 69. The next such occurrence is at 514. Let me ask a question. Why should there be 18 occurrences of 211, 17 occurrences of 212, 27 occurrences of 214, 22 occurrences of 215 but only seven occurrences of 213? Probably nothing more than the way the dice fell.
The highest total reached by two different teams is 617. In the innings played category, 226 and 252 were the most frequent scores. No surprise that the most popular all-out score is also 296, with 30 occurrences, which means that this score was attained seven more times in an incomplete innings. Not unexpectedly, the next one is 252, with 29 occurrences which indicates five other incomplete innings. These two were in the top positions in the innings played category also. The third one is 240, also with 29 occurrences. What is so great about 296 and 252?
The mean score for the 5,317 innings is 273.6. The Median score is 257. Let us not forget that these are completed innings. So this number gives us a comfort feeling. The 90-percentile is reached around the score of 434 meaning that fewer than 10% of scores are above this mark.
Even here, since there are over 800+ team scores, it is not possible to do a graph with the individual values. Hence I have grouped these scores in groups of ten score values. 0 to 9, 10 to 19, 20 to 29 and so on. Then we can at least get an idea of the distribution.
The graph follows a more well-defined normal distribution between 0 to 600 than the earlier team scores, possibly because this includes only all-out situations and the lowest is 26. Since these are scores in ranges (120-129, 210-219 and so on), this only gives an idea of the score distribution. The highest frequency is at the same score range, 250-259, with 213. The next highest is some distance away, again at 220-229, which has a frequency of 208. The next best is in between, at the range of 240-249, with a frequency value of 188.
Partnerships
Partnerships do not offer as much variety as batsman and team scores. A hundred is very important to a batsman but not necessarily to a pair. However this will round off the article.
There have been a total of 64,198 partnerships. This may not match some other data derivations since this analysis is solely based on the FoW data in the scorecards. The information about a player retiring and another one took taking his place, is not always available since only the scorecard is considered. The average runs added per partnership is 29.6.
There are well over 10,000 partnerships with no run added. The highest, of course, is 624 by the two Sri Lankan greats. There have been over 3,900 partnerships of 100 and over, 489 pairs of batsmen have added 200 and over. Seventy-seven have crossed 300 and 14 have gone past 400. Let me repeat that these figures might be off by a few since retirements and three-batsmen partnerships might affect the numbers.
There does not seem to the frenzied change of frequencies around the hundred-mark. This is understandable since a partnership reaching hundred is probably considered less significant than a batsman reaching hundred. The other significant feature of the individual and partnership distributions is the continuous declining trend from zero onwards, unlike the team distributions which follow a normal distribution pattern. The reason could be that the individual innings and partnerships end with a single dismissal and across different type of batsmen, the initial stages are most difficult to navigate through.
The difference between the scores of 0 and 1 is quite revealing. Individual score values for 0 is 9,191 and 1 is 3,682. Partnership frequency for 0 is 10,260 and 1 is 2,383. This steep drop for partnerships can be attributed to the fact that the partnership ends when either batsman gets out increasing the chances of it being broken at 0.
Fall of Wickets
I have already gone way past the estimated size of the article. Hence I am only going to give the summary of the fall of wickets numbers.
Seven-hundred-and-seventy wickets fell at 0, which is the highest. Then the numbers oscillate either side of 200 for the next 200 runs, indicating a very balanced distribution of fall of wickets. Then the numbers drop off slowly until we reach the first of the zero occurrence situations. This is as late as 622. Who could imagine that the first occurrence of the score at which no wicket has fallen would be 622? The highest score at which a wicket has fallen is 924. The highest score at which wickets have fallen in different matches is 707, at which 3 wickets have fallen.
One quirky table: Product of score and batting position ???
In line with the mood of the article, I am rounding off with a quirky table. A hundred scored at number nine is normally much more valuable than one scored at no.3. Many a late order fifty might be more valuable than a top order hundred. So I created a new table by multiplying the batsman score by the batting position (openers considered as 2). I created a table where the product was 1,000 and more. There are many variations possible to this idea. All high order positions can be normalized to, say, six. And so on. However the emphasis is more on high low-order innings.
A total of 142 innings qualified. I have shown here the top ten innings. The complete table can be downloaded. I am quite sure a finicky reader might say, "How can I multiply two disparate values?", "4x200 or 3x250 is more valuable than 10x100" and so on. I agree that it is quirky but does not matter a tinker's damn. This article is not about proper numerical methods but one which emphasises the beauty of numbers. No serious conclusions should be drawn.
Batsman Test I BP Runs BP*Runs
To download/view the composite file containing all tables, a veritable treasure-trove of information, please CLICK HERE.
I have had so much fun in doing this article that I will do the same for ODIs also.
Anantha Narayanan has written for ESPNcricinfo and CastrolCricket and worked with a number of companies on their cricket performance ratings-related systems