Let's cut to the T20I chase
An analysis of the trends and factors that impact results in T20 internationals
Anantha Narayanan
15-Apr-2017
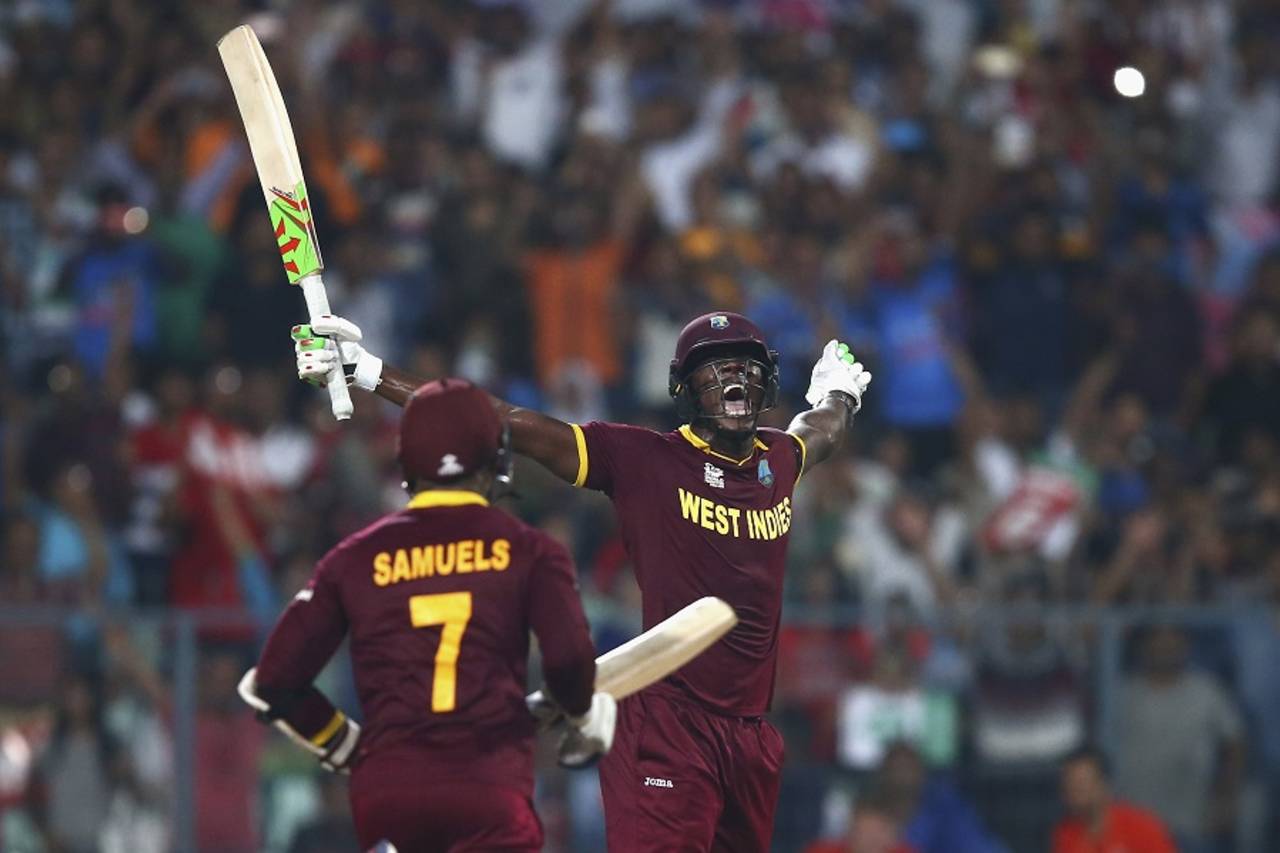
The target of 19 runs chased down by West Indies in the 2016 World T20 final is the highest 20th-over target successfully chased in T20Is • Getty Images
In a recent fascinating article, Kartikeya Date dissected the T20 winning strategies with some nifty number work, which showed that seemingly good strategies were not so sound; nothing really could be taken for granted. The crux of the matter is that the ODI and T20 formats need widely varying strategies but the basic game, in terms of runs-scoring opportunities, is virtually identical.
In this article, I am looking at the T20 results from a more general team angle, which will, in a way, complement Kartikeya's analysis.
My analysis is limited to T20 internationals (T20Is). As of March 31, 2017, 603 T20Is had been played. However, five of these matches were abandoned without a ball being bowled and another nine ended as "no result". That leaves us with 589 matches. Of these 22 matches were decided using D/L calculations, making analyses of these matches somewhat futile. There were nine ties, with tie-resolution mini-contests in place for each.
Let me start with a simple analysis of wins by teams.
| Team | Matches | Wins | Win % |
|---|---|---|---|
| Afghanistan | 58 | 39 | 67.2% |
| India | 80 | 49 | 61.2% |
| Pakistan | 112 | 67 | 59.8% |
| South Africa | 95 | 56 | 58.9% |
| Sri Lanka | 93 | 51 | 54.8% |
| New Zealand | 97 | 51 | 52.6% |
| Australia | 93 | 47 | 50.5% |
| West Indies | 84 | 41 | 48.8% |
| England | 92 | 45 | 48.9% |
| Ireland | 58 | 26 | 44.8% |
| Bangladesh | 65 | 20 | 30.8% |
| Zimbabwe | 54 | 14 | 25.9% |
It is time to stand back and salute those doughty warriors from the battle-scarred country of Afghanistan. They have the best record among all teams playing T20Is. And let us not dilute this achievement by saying that Afghanistan faced lesser opponents. At their level, they often faced opponents who were no less than them. For instance, they faced Ireland ten times. So this honour is well-earned. They have won more than two out of three matches they played. And let us not forget that there is no home advantage for them.
India are second with a win percentage of just over 61%. They went off the boil for a few years after their maiden triumph in 2007 but have recently put together strings of important results. Pakistan have always done well in T20Is and are deservedly in third place. South Africa and Sri Lanka follow them. Australia's mental confusion handling the format is shown in their relatively poor placing. Let us not forget that Australia played a T20I a day before their recent tour of India. Ireland are ahead of Bangladesh and Zimbabwe, who have poor figures.
| Team | F-Bat matches | Wins | Win-% | S-Bat matches | Wins | Win-% |
|---|---|---|---|---|---|---|
| Afghanistan | 31 | 21 | 67.7% | 27 | 18 | 66.7% |
| India | 40 | 24 | 60.0% | 40 | 25 | 62.5% |
| Pakistan | 57 | 38 | 66.7% | 55 | 29 | 52.7% |
| South Africa | 55 | 31 | 56.4% | 40 | 25 | 62.5% |
| Sri Lanka | 48 | 28 | 58.3% | 45 | 23 | 51.1% |
| New Zealand | 49 | 28 | 57.1% | 48 | 23 | 47.9% |
| Australia | 45 | 21 | 46.7% | 48 | 26 | 54.2% |
| West Indies | 44 | 22 | 50.0% | 40 | 19 | 47.5% |
| England | 44 | 23 | 52.3% | 48 | 22 | 45.8% |
| Ireland | 25 | 11 | 44.0% | 33 | 15 | 45.5% |
| Bangladesh | 27 | 9 | 33.3% | 38 | 11 | 28.9% |
| Zimbabwe | 28 | 9 | 32.1% | 26 | 5 | 19.2% |
| Other teams | 96 | 35 | 36.5% | 101 | 48 | 47.9% |
| Total | 589 | 300 | 50.2% | 589 | 289 | 48.2% |
This is a follow-up to the overall team analysis. In this table I analyse the way the teams won, whether batting first or second. First, the overall numbers. Out of the 589 matches that ended decisively, 300 teams won batting first and 289 batting second. The closeness of these numbers (51.1% v 48.9%) will settle one myth: that batting second is a decisive benefit. These values are quite close to coin toss-up numbers.
However, that is only at the total level. At the individual team levels, there are marked differences. Not with Afghanistan, though. It is clear that the Afghans will get you whether batting first or second. Either way they win two matches out of three. Amazing team, indeed. I hope they get to play Test cricket soon. India are almost similar, with a slight edge when they bat second, but not very significant. However, Pakistan handle their two innings very differently. They win 67% of the matches batting first and are much less successful while chasing. This is understandable considering they have always had excellent bowlers.
South Africa win more matches chasing, but not by much. Sri Lanka win more matches batting first, again by not much. New Zealand are clearly a batting-first team, with attacking batsmen who are comfortable setting targets.
Australia prefer chasing. West Indies and England prefer setting targets. On balance, I would say that Pakistan's differentials are the most significant numbers in this list. The opposing captains should think twice before putting Pakistan in to bat. New Zealand also have some significant variations.
While it is true that the teams will have their successes batting first or second, it is essential to look at this in terms of the countries in which the matches are played.
| Country | Matches | FB Wins | FBWin-% | SB Wins | SBWin-% |
|---|---|---|---|---|---|
| United Arab Emirates | 93 | 51 | 54.8% | 42 | 45.2% |
| Bangladesh | 68 | 32 | 47.1% | 36 | 52.9% |
| South Africa | 65 | 28 | 43.1% | 37 | 56.9% |
| India | 54 | 26 | 48.1% | 28 | 51.9% |
| England | 53 | 30 | 56.6% | 23 | 43.4% |
| Sri Lanka | 50 | 31 | 62.0% | 19 | 38.0% |
| West Indies | 49 | 28 | 57.1% | 21 | 42.9% |
| New Zealand | 35 | 17 | 48.6% | 18 | 51.4% |
| Australia | 33 | 18 | 54.5% | 15 | 45.5% |
| Ireland | 28 | 7 | 25.0% | 21 | 75.0% |
| Zimbabwe | 20 | 14 | 70.0% | 6 | 30.0% |
| Pakistan | 3 | 1 | 33.3% | 2 | 66.7% |
| Other countries | 38 | 17 | 44.7% | 21 | 55.3% |
| Total | 89 | 300 | 50.2% | 289 | 48.2% |
Surprisingly, or some would say, not so surprisingly, the UAE has hosted the most T20Is: 93. There is a clear and noticeable difference in the UAE. The first batting team is ahead by nearly 10%. In Bangladesh, it is the other way around. The chasing teams win over 5% more matches. South Africa presents a very clear case of chasing. There is a differential of over 13%. In England, 13% of the teams win batting first.
In India there is no great difference. Only 2% separates the two winning possibilities. However, in Sri Lanka, more than 60% of the matches are won by batting first. This is a 24% differential. Enough to put the visiting captain on notice. West Indies has almost similar numbers. The teams batting first are ahead by a huge 15%. New Zealand favours the chasing team, but not by much.
In Australia, you bat first. In Ireland, a whopping 75% of the matches are won by teams batting second. Zimbabwe, on the other hand, favours the first batting team by a huge margin.
This is a really topsy-turvy situation. The huge differences in Sri Lanka, West Indies, England, South Africa, UAE, Ireland and Zimbabwe are very striking.
First-innings analysis
What we have seen until now are routine tables. But there is a need to delve a little bit more into how teams plan their innings. I have developed a theme of analysing the halfway stage in the innings. There are some interesting derivations from these.
What we have seen until now are routine tables. But there is a need to delve a little bit more into how teams plan their innings. I have developed a theme of analysing the halfway stage in the innings. There are some interesting derivations from these.
Let us take the ODI game first. Notionally the halfway stage is at the 25-over mark. However, because of the moderate start and consolidation in the first 25 overs, much less than 50% of the target, notional or otherwise, gets achieved. There is continued consolidation but the speeding up starts around the 35-40 over mark. So these are unequal halves. It has been observed that the 30-over stage is almost the de facto halfway mark. Just take the amazing win by West Indies in the first ODI of the recent series in Providence. In the first innings, Pakistan made 308, reaching 132 in 25 overs and 155 in 30 overs. When West Indies chased, they reached 105 was reached at 24.2, 144 at 30 and a final score of 309 in 49 overs.
The T20 format works differently. The halfway stage is really a halfway stage in terms of scoring. The first half has six overs of good scoring and some five-to-six-run overs. The second half starts with similar low-key five-to-six-run overs until the 15th over and then the final rush takes place.
In the recent IPL match between Gujarat Lions and Kolkata Knight Riders, Lions scored 91 runs in ten overs and reached a final total of 183 in 20. In the Knight Riders' blitzkrieg response, they reached 98 in 7.2 overs and a final score of 184 in 14.5 overs. The halfway scores are around the halfway mark of the final scores.
I will analyse the halfway scores reached in appropriate qualifying innings, whether first or second. For the first innings, I have taken all innings in which 20 overs were completed. Not one ball less. I want to ensure that the ball resource is fully utilised.
| % of final score at 10 overs | Innings | Wins | Win % | Group % |
|---|---|---|---|---|
| 23.4% - 40.0% | 97 | 58 | 59.8% | 20.3% |
| 40.0% - 45.0% | 158 | 95 | 60.1% | 33.2% |
| 45.0% - 50.0% | 133 | 77 | 57.9% | 26.9% |
| 50.0% - 55.0% | 85 | 40 | 47.1% | 14.0% |
| 55.0% - 70.1% | 37 | 16 | 43.2% | 5.6% |
| ----- | ||||
| Total | 510 | 286 | 56.1% |
In the 589 matches played, there were 512 completed first innings: 20 overs only, not innings in which teams were dismissed, although six teams were dismissed but still won. Two of these 512 matches didn't have complete ball-by-ball data, so that leaves us with 510 completed first innings to analyse. The halfway mark in all these matches is ten overs.
The percentage of the final score reached in ten overs ranges from 23.4% to 70.1%. First, let me deal with the two extreme values. In the 2012 World T20 final in Colombo, West Indies batted first and were tied down by accurate bowling from Angelo Mathews, Nuwan Kulasekara and Ajantha Mendis. At the end of ten overs, West Indies were staring at the impossible score of 32 for 2, the first three overs yielding a single. Then Marlon Samuels and Darren Sammy cut loose and took West Indies to a competitive total of 137 for 6, the last ten overs yielding 105 runs, over three times the tally in the first ten. They got the momentum and went on to complete a famous win.
At the other end of the spectrum, when Zimbabwe played Pakistan in 2008 in Canada, they had a rollicking start and scored 75 for 1 in the first ten overs. Any team would have reached 150. For some inexplicable reason, Zimbabwe scored a remarkable 32 for 7 in the next ten overs. I cannot fathom this change at all. How does a team lose its way so completely? That too against the average spin bowling of Shoaib Malik and Fawad Alam. It is no wonder that Pakistan won, albeit in a laborious manner.
Let us now look at the distribution of the percentage values reached. There are very significant derivations to be made out of the numbers.
First, the overall numbers. When the teams completed their 20 overs, they won 56% of the matches. The 12% differential suggests that if a team bats out its overs, not wasting any ball resource, it has the odds clearly in its favour. How often have we seen teams getting all out in the 20th over (32 times) and losing, at times again in the 20th over? Teams should go out of the way to bat until the end of the innings.
Some startling revelations appear when we look at the percentage values reached. The first two groups, 23.4 to 40% and 40 to 45% have win percentages around 60. This is a 20% differential and has to be respected. There is only a slight drop of 2% when we look at the next grouping, 45 to 50%. This means that if the percentage achieved is less than 50%, the teams win 59.5% of the times. As the percentage exceeds 50, the win percentage drops below 50 and in the last grouping, the value is only 43%. These numbers are mind-boggling.
What could be the reasons behind these numbers?
1. Carrying forward the momentum. The team that did not start well but finished strongly carries a lot of momentum. And the other way around for the other team. I am now beginning to believe in this maxim. I have already talked of the World T20. I am certain it was the momentum that won the match for West Indies.
2. Top-class opening bowlers. It is possible that the top-class opening bowlers are tackled carefully and with respect. Then come the lesser bowlers, to be made a feast of. Obviously in a few of the matches.
3. Differing bowling quality in the two halves. It is also possible that the first half of many teams are generally bowled by the better bowlers and the second half by allrounders and the fifth bowlers.
4. Differing settling-down times. It is possible that the batsmen who bat early in the order take more balls to settle down and this reduces the overall scoring rate. Maybe it is a case of four balls versus two balls, but taken across four-five batsmen, this could prove significant.
Second-innings analysis
Now we come to the analysis of the second innings. A very different scenario indeed. For one thing there is a clear target to be reached. Many matches could end well before the allotted 20 overs. So the selection of innings for analysis is a tricky matter. Should I really care about a match like the recent one between India and England in Bengaluru (India: 202 for 7, England: 127 all out in 16.3 overs)? Would it matter whether England scored 40 or 80 at the halfway mark of 8.1 overs? Similarly, the one between Pakistan and West Indies in Abu Dhabi last year (West Indies: 103 for 5, Pakistan: 108 for 2 in 15.1). Pakistan's win was so comfortable that we would gain nothing by analysing how their innings progressed.
Now we come to the analysis of the second innings. A very different scenario indeed. For one thing there is a clear target to be reached. Many matches could end well before the allotted 20 overs. So the selection of innings for analysis is a tricky matter. Should I really care about a match like the recent one between India and England in Bengaluru (India: 202 for 7, England: 127 all out in 16.3 overs)? Would it matter whether England scored 40 or 80 at the halfway mark of 8.1 overs? Similarly, the one between Pakistan and West Indies in Abu Dhabi last year (West Indies: 103 for 5, Pakistan: 108 for 2 in 15.1). Pakistan's win was so comfortable that we would gain nothing by analysing how their innings progressed.
It is clear that if the match ends, say within the first 18 or 19 overs, either a team has chased successfully (and easily) or has been dismissed. So I have to select matches which were is open until a later stage. I have decided to only look at innings that went past the 19th over: In other words, ball no 19.1 and beyond. The last over is a fascinating part of the game and deserves a closer look. These are matches that were up for grabs after 95% of the innings (and over 97% of the match) was completed.
First, let me look at the beginning of the last over, i.e. just before ball no 19.1 is to be bowled.
| Runs needed to tie | Matches | Wins | Win % | Losses |
|---|---|---|---|---|
| 0-20 runs needed | 179 | 96 | 53.6% | 83 |
| 21-174 runs needed | 128 | 0 | 0.0% | 128 |
| ------ | ||||
| Total | 307 | 96 | 31.3% | 211 |
A total of 307 matches qualify. These matches were alive when ball 19.1 was about to be bowled. Of the other 282 matches that finished before the start of the 20th over, 193 were won by the second batting teams and 89 by the first batting teams. Let us look at these 307 matches.
If your team is chasing and has have reached the 20th over, it has a chance of success of only around 31% - less than one in three matches. It is true that there are many matches that are out of reach. Let us look at the other matches.
The maximum number of runs scored in the last over to win is 19. Yes, I know that more runs have been scored to win matches. However, these were superfluous runs. The last over in the 2016 World T20 final holds the record, with 19 (24) runs. Hence I have selected matches in which 20 runs were needed as possible wins. I have also taken the common sense move that I will consider the runs required to tie the match since there is always a second chance if the match is tied.
In 179 of these matches, teams needed 0 (already the match was tied) to 20 to tie the match. Out of these 179, 96 were won by batting teams and 83 by the defending team. This means the batting team won 53% of the matches. These include nine tied matches: four were won by the batting team and five by the bowling team. The other 128 matches, in which 21 to 174 runs were needed to tie, were all won by the bowling team. This is as expected. The cut-offs were fixed this way.
Now, for the matches that went to the last ball.
| Runs needed to tie | Matches | Wins | Win % | Losses |
|---|---|---|---|---|
| 0-6 runs needed | 57 | 22 | 38.6% | 35 |
| 7-86 runs needed | 143 | 0 | 0.0% | 143 |
| ------ | ||||
| Total | 200 | 22 | 11.0% | 178 |
A total of 200 matches qualify. These matches were alive when ball no. 19.6 was going to be bowled. Of the other 389 matches that finished before the start of the last ball, 267 were won by the second batting teams and 122 by the first. Let us look at these 200 matches.
If a chasing team reaches the last ball of the game, they are almost totally out of the picture. They have a chance of success of only around 11% - one in nine matches. Let us look at the other matches.
Until now, in the history of T20Is, no match has been won or tied with a six when five or six runs were needed to win or tie the match. The maximum number of runs scored in the last ball to win is four. Yes, I know that Carlos Brathwaite, Colin Munro, Michael Hussey, Jos Buttler, Chamara Kapugedera and a few others have finished off their respective matches with sixes. But they needed only singles to win the matches. Other batsmen have hit sixes off the last ball match to win matches when fewer runs were needed. Hence, these were superfluous runs. However, for analysis, I have separated matches in which six runs were needed for a tie. This is eminently possible.
In 57 of the matches, teams needed 0 (already the match was tied) to 60 to tie the match. Out of these 57, 22 were won by batting teams and 35 by the defending team. This means the batting team won 39% of the matches. The other 143 matches, in which 7 to 86 runs were needed to tie, were all won by the bowling team.
Let us review what we have learnt so far in this series of analyses.
1. Any team that completes its quota of overs in the first innings has a clear edge in the game. They win 56% of the time. Teams should remember this axiom. Take extra care if you are, say 130 for 7 in 17 overs. Do not aim for 165 and finish at 140 all out. It is better to finish at 150 for 9. It is not very easy for the late-order batsmen to think and take singles. But they should adjust and play sensibly, and not like Amit Mishra, who swung five times without success in Bengaluru recently, instead of tapping the ball for a single and giving Rishabh Pant the strike. Not necessarily a comparable situation, but the axiom still holds.
2. If the team has reached the 20th over and still has a lot to do, the bus has already left. The team taking the ball at 19.1 has a success chance of around 31%. On 307 occasions teams reached this point and there were only 96 wins for the batting teams. If the team has reached the last ball, one may as well give up, if not already done before. This has happened 200 times and only 22 teams have been successful. The moral: finish off the match, if you can, earlier or leave very little to do in the last over and certainly off the last ball.
3. There were nine ties. The common perception is that the second-batting team has the edge, that the attacking batsmen at the crease could continue and set tough targets. However, in theory, the second batting team, which batted first in the eliminator, wins only four of the nine matches. There seems to be no momentum with the second batting team. But it must be said that three early tied matches were decided by bowl-outs, going 2-1 in favour of the second batting teams. The six shoot-outs finished three apiece.
4. Twenty-two of the matches were decided through the D/L method. The common perception is that D/L favours the team batting second. However, 12 of these matches were won by teams batting first and ten by teams batting second. If anything, D/L seems to favour the first batting teams, which might be a result of the ICC adopting the methodology, designed and optimised for ODIs, and not asking for a custom-made system for T20 format.
Anantha Narayanan has written for ESPNcricinfo and CastrolCricket and worked with a number of companies on their cricket performance ratings-related systems